
Bottom line: DME billing KPIs tell you where revenue is being lost and how fast - at least, they should.
The most useful ones point back to a specific workflow step you can fix, like a low clean claim rate that traces to documentation gaps at intake. Track a focused set, read them together, and act on the upstream cause instead of the number.
What Are DME Billing KPIs?
DME billing KPIs are the measurements that show how well your revenue cycle turns delivered equipment into collected payment. They cover the full path: how clean claims are when they go out, how often payers deny them, how long money sits in accounts receivable, and how much of what you billed you actually collect.

The value is in what the number tells you to change. A denial rate is a symptom. The cause usually lives earlier in the workflow, at intake, documentation, coding, or authorization. Good KPIs work as a diagnostic. How? Well, they should tell you which step is costing you money so you can fix the process, not just report the result.
Track TOO many and the dashboard becomes noise. Track the right handful and you can see a problem forming before it shows up as aged A/R.
The Core DME billing KPIs to Track
These are the metrics that most directly connect to cash flow and to a fixable workflow step:
- First-pass clean claim rate. The share of claims accepted on first submission without edits or rework. Low rates point to documentation or coding defects entering the queue.
- Denial rate. The percentage of claims denied. Break it down by reason and payer, because the reason tells you the upstream cause.
- Days sales outstanding (DSO), or days in A/R. How long, on average, money sits before it's collected. Rising DSO means cash is slowing down.
- A/R aging by bucket. How much is 0 to 30, 31 to 60, 61 to 90, and 90-plus days out. The older buckets are where recovery gets hard.
- Net collection rate. Of what you were allowed to collect, how much you actually did. This catches revenue written off or lost to timely-filing.
- Cost to collect. What it costs in labor and systems to bring in a dollar. Manual rework drives this up quietly.
- Denial recovery rate. Of denied claims worked, how many you overturn and collect.
Read these together, not in isolation. A clean claim rate that looks fine next to a rising denial rate usually means the defects are slipping past your front-end checks.
Why Do Lagging KPIs Like A/R Days Start Upstream?
Days in A/R and net collection rate are lagging indicators. By the time they move, the cause is weeks old. A claim that ages to 90 days was often defective the day it was created, not the day it aged.
The chain is direct:
- A missing document at intake leads to a denial at billing, which adds 30 or more days to that claim's A/R.
- A modifier error leads to a rejection, a resubmission, and a second trip through the payer's clock.
- A missed authorization before delivery leads to a claim that may never be collectible at all.
This is why chasing a lagging KPI by working the A/R harder has limits. You can staff up the follow-up team and still watch DSO climb if defective claims keep entering the queue. The leverage is at the source. Improve the clean claim rate and the aging buckets shrink on their own, because fewer claims need a second cycle to get paid.
How to Turn KPIs Into Action, Not Just Reports
A KPI earns its place when it changes a decision. The pattern is the same for each one: segment it, trace it to a workflow step, and put a check at that step.
Practical moves:
- Segment every KPI by payer and product category. A single blended denial rate hides the two payers causing most of the problem.
- Tie each denial reason to the workflow step that produced it, then fix that step.
- Watch leading indicators, like clean claim rate and documentation-complete rate, so you see trouble before A/R reflects it.
- Set a target range per KPI and review against it on a fixed cadence, not only when cash feels tight.
- Assign an owner to each metric. A number with no owner does not improve.
The goal is a short feedback loop: a KPI moves, you know which step to check, and a validation rule keeps that defect from repeating.
Manual Reporting vs Automated KPI Tracking
How you produce the numbers shapes how fast you can act on them.
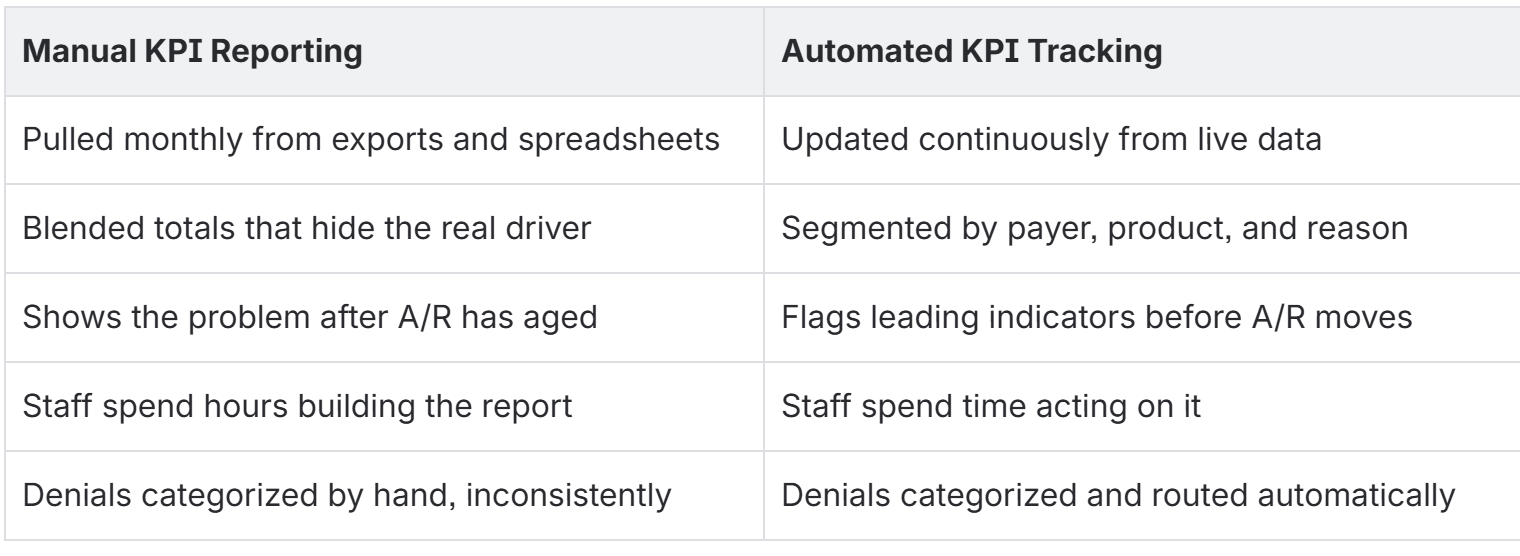
Automation is not just faster reporting. It closes the loop. When the same rules that measure a defect also catch it at intake, the KPI and the workflow improve together, and the same team keeps up with more volume.
DME Billing KPIs FAQs
What is the most important DME billing KPI?
There isn't a single one. First-pass clean claim rate and days in A/R together give the clearest picture, because clean claims are the leading cause of low A/R days. Watch them as a pair.
What is a good clean claim rate for DME?
Many operations target a high first-pass rate and treat anything well below it as a signal of front-end defects. Set your own target from your baseline and payer mix rather than a generic number, then work to raise it.
Why do DME billing KPIs look fine but cash flow is still slow?
Usually because the metrics are blended. A healthy overall denial rate can hide one payer or product line that's driving most of the aged A/R. Segment before you conclude the numbers are fine.
Do KPIs tell me where to automate first?
Yes. Your denial reasons and aging buckets, segmented by category, point straight to the highest-friction step. That's where validation delivers the fastest return.
How often should I review DME billing KPIs?
Leading indicators like clean claim rate deserve a weekly look. Lagging indicators like net collection rate work on a monthly cadence. The point is a fixed rhythm, not a scramble when cash tightens.
Where to Start?
You don't need a full dashboard on day one. Build it from what's already hurting:
- Pull 60 to 90 days of denials and A/R aging.
- Segment both by payer and product category.
- Rank the top denial reasons by volume and revenue impact.
- Trace each top reason to its upstream workflow step.
- Put a validation check at that step and set a target for the related KPI.
- Review on a fixed cadence and expand the metric set once the first fixes hold.
KPIs are only useful if they change what you do. Start with the numbers that trace to a fixable step, close that gap at the source, and let the lagging metrics follow.
